The basics on how to get data from the EDI repository
Authors
Greg Maurer
Darren James
Published
July 31, 2026
Introduction
This lesson will teach you several methods for accessing Jornada data at the Environmental Data Initiative (EDI) repository. EDI has recently become more strict about data access and now requires authentication for downloading data files.
1. Downloading from the portal
The EDI Portal (portal.edirepository.org) is the main graphical interface to the repository. It provides a search interface and landing pages for all datasets, and provides a way to download the files published as a part of any dataset.
Downloading data requires “authentication” - i.e. you have to be logged in with a non-anonymous account. EDI makes it easy to use your pre-existing Google or GitHub account to authenticate.
2. EDIutils
The EDIutils R package is a wrapper around the EDI repository’s API. It provides functions to search and access the data published in EDI from the comfort of your R scripts
# Access Jornada data from the EDI repositorylibrary('tidyverse')
── Attaching core tidyverse packages ──────────────────────── tidyverse 2.0.0 ──
✔ dplyr     1.2.1     ✔ readr     2.2.0
✔ forcats   1.0.1     ✔ stringr   1.6.0
✔ ggplot2   4.0.3     ✔ tibble    3.3.1
✔ lubridate 1.9.5     ✔ tidyr     1.3.2
✔ purrr     1.2.2
── Conflicts ────────────────────────────────────────── tidyverse_conflicts() ──
✖ dplyr::filter() masks stats::filter()
✖ dplyr::lag()    masks stats::lag()
ℹ Use the conflicted package (<http://conflicted.r-lib.org/>) to force all conflicts to become errors
library('EDIutils')# Data access at EDI requires authentication. The easiest way is to create# an API key at https://auth.edirepository.org. Once you have that, place # it in your script. Below, we're getting it from an environmental variable,# but you can replace the "Sys.getenv" part with your actual key.mykey <-Sys.getenv("EDI_API_KEY")# Log in to EDI rogrammatically with an API keyEDIutils::login(key = mykey)
Logged in with EDI-API key.
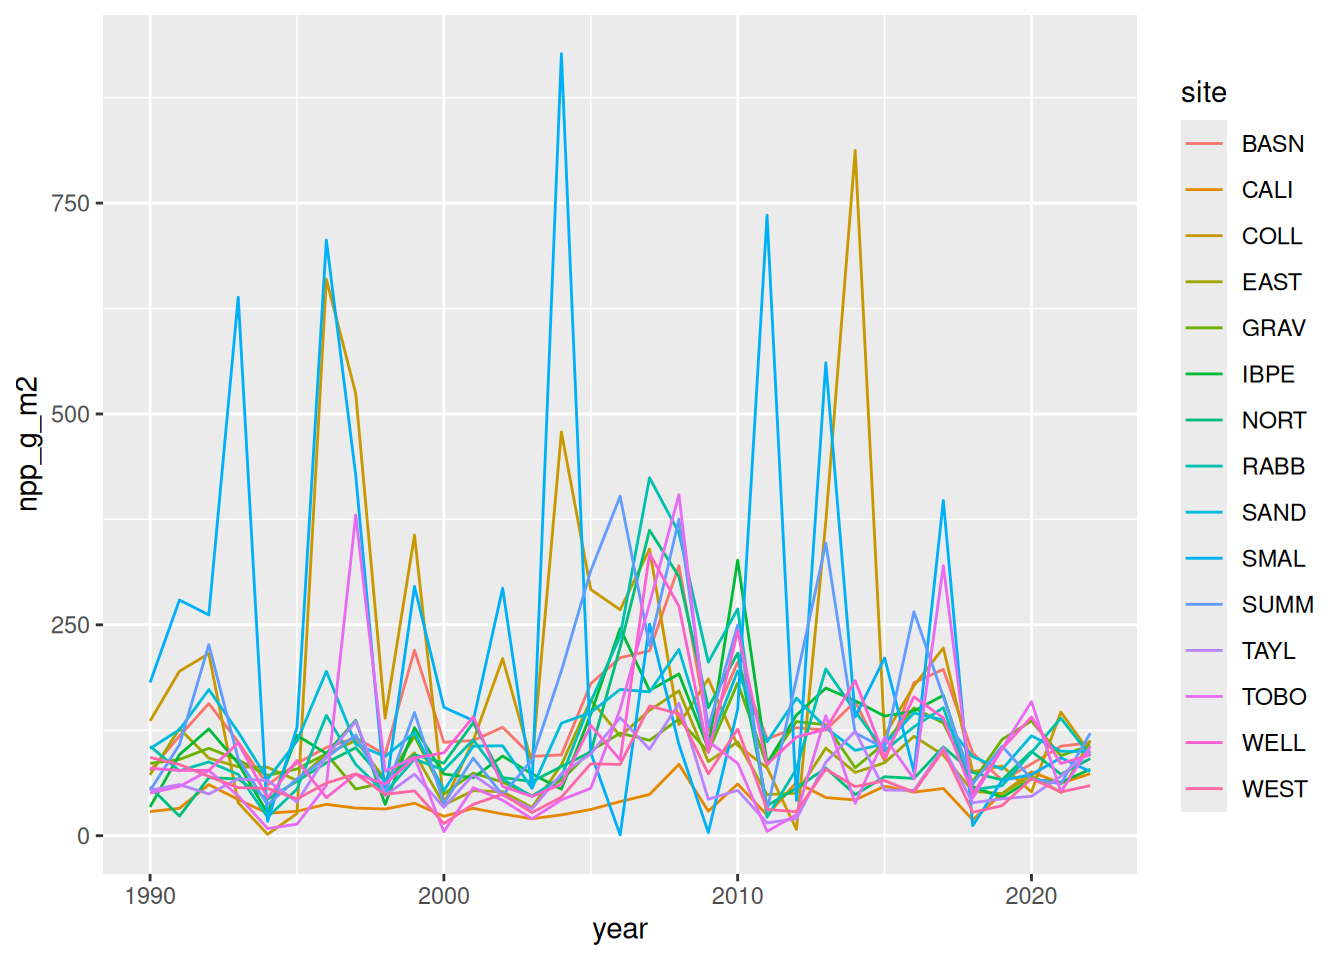
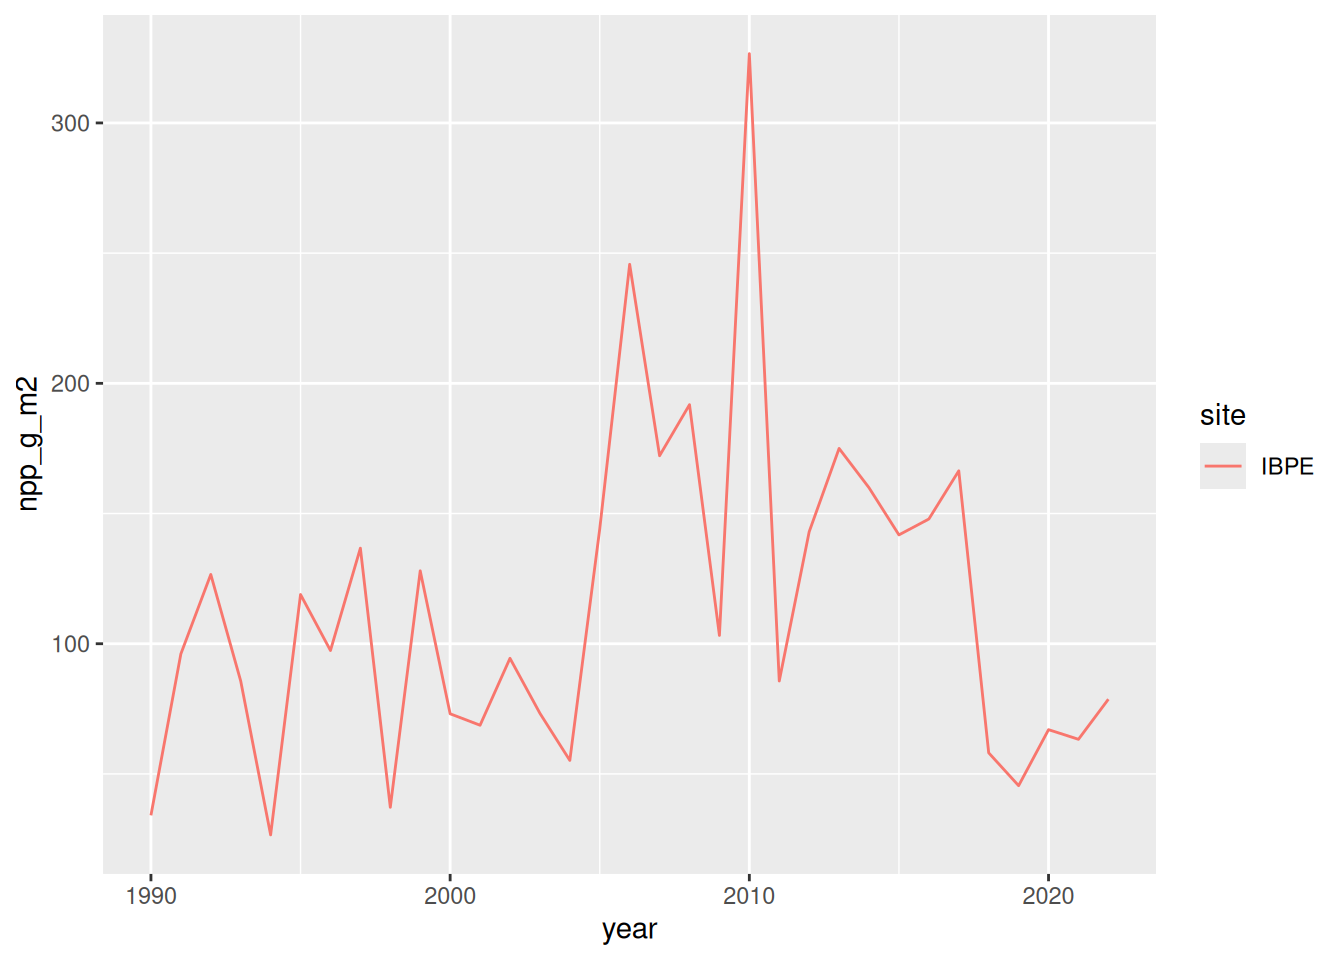
# Set the dataset IDdatasetID <-"knb-lter-jrn.210011003.106"# Read the list of "entities" in the datasetents <-read_data_entity_names(datasetID)# Read the raw entity dataraw <-read_data_entity(datasetID, ents[1, "entityId"])# Now read the raw data as a CSVdf <- readr::read_csv(file = raw)
Rows: 495 Columns: 4
── Column specification ────────────────────────────────────────────────────────
Delimiter: ","
chr (2): zone, site
dbl (2): year, npp_g_m2

ℹ Use `spec()` to retrieve the full column specification for this data.
ℹ Specify the column types or set `show_col_types = FALSE` to quiet this message.
# Explore the data a littlehead(df)
# A tibble: 6 × 4
   year zone  site  npp_g_m2
  <dbl> <chr> <chr>    <dbl>
1  1990 C     CALI      28.6
2  1990 C     GRAV      85.7
3  1990 C     SAND     103.
4  1990 G     BASN      77.2
5  1990 G     IBPE      34.1
6  1990 G     SUMM      53.7